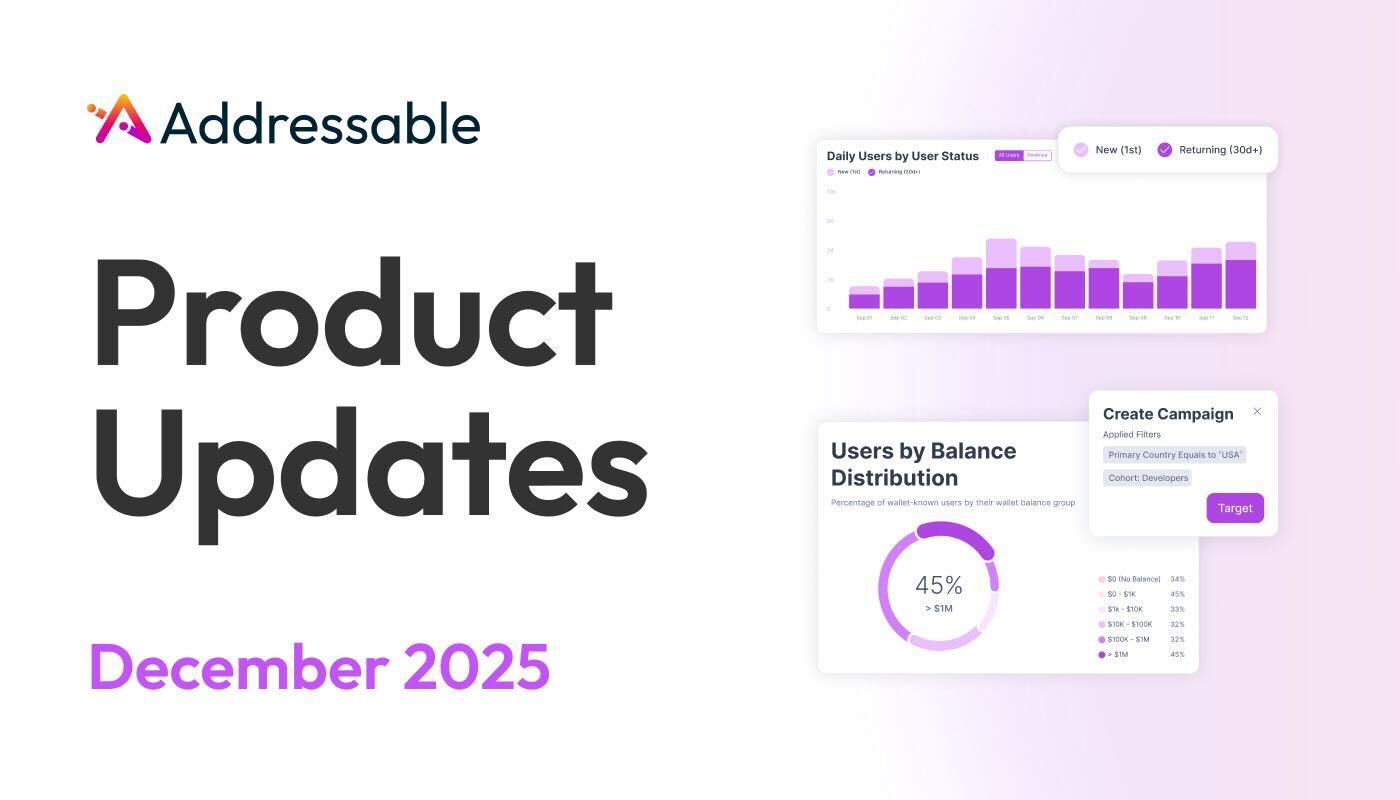
Addressable’s October 2023 updates: Performance dashboard, improved view filtering, results by channel & more


%20(1).png)
Autumn is here, so have your click and acquisition costs make like the leaves and fall! A new global dashboard lets you easily synthesize and filter campaign results, including by channel: Includes both Addressable and non-Addressable campaigns, full filterability, 4 campaign-level metrics and converted vs potential user analysis.
TL;DR:
1. New global performance dashboard with both Addressable and non-Addressable campaign results
- Fully customize your performance dashboard by any date range.
- Results by channel (max 10), totals and over time: visits, wallet connects, conversions
- Results by campaign: Unique users, unique wallets, conversions, CPC (if applicable)
- Compare converted users vs potential users who visited, but didn’t convert
2. Your Campaigns Screen is now filterable by column or date and can save default custom views
New global campaign dashboard, including channel level analysis
Your 1-stop-shop for Addressable and non-Addressable campaign metrics. The ideal insight mix to fuse on-chain Web3 and Web2 insights about users across any timeframe, then target them all in one tool. Includes total daily site visits, conversions, and conversion rate always show atop, but you can set any time range for the rest of the dashboard at the very top, or filter individual sections by time or value.
The funnel tallies (via left side hover) and visualizes your channel source mix for visits, wallet connects, and conversions by type via the Addressable events engine’s utm_campaign tracking. See more below.
See performance by channel (up to 10): Visits, wallets connected, conversions
The channel summary table is each channel’s event-level breakdown. Click a channel for campaign-level results. Filter the unique users per channel chart by time or channel(s) by clicking names on the right.
Or by campaign: Unique visitors and wallet connects, conversions & CPC (if applicable)
View up to 4 campaign-level metrics and converted users in the last week. Filter any of the campaign charts daily or weekly, or by campaign(s) or conversion event type(s) by clicking the names on the right.
Compare converted users and potential users who visited your page, but didn’t convert
Compare both types of users by channel, 3 ranges of wallet balance distribution or geographically.
Customize your campaign list across date and column filters
Use the Custom Columns dropdown or date fields at the top right to frame your performance data based on your needs. You can save any view to be your default view from that point on.
We look forward to sharing even more great updates next month!
Have a feature in mind that you think we should offer? Got feedback on changes or want to share your opinion about our current platform and how it’s working for you?
Get in touch with us - we’d love to hear from you.